Problem
FYF programme data lived in spreadsheets with no live reporting, so school-level activity and officer performance were hard to monitor in real time.
My Role
Built the dashboard end to end — architecture, data layer, and UI.
Technology/Approach
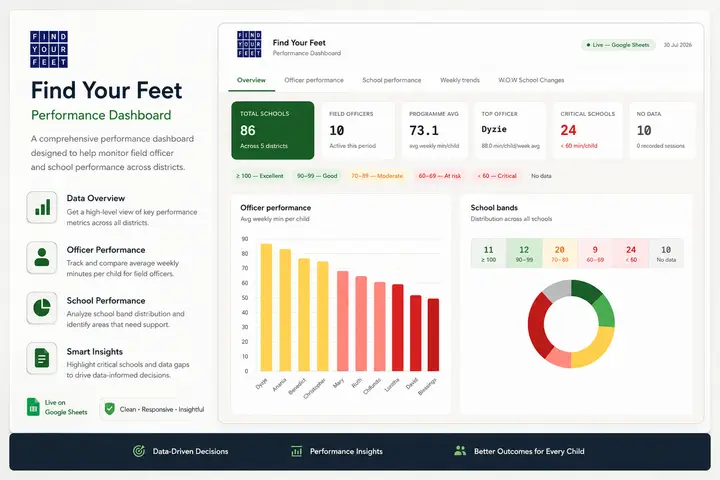
A zero-backend SPA (Vite + Chart.js) pulling live data from Google Sheets via the Google Visualization API, with colour-coded performance bands, four dashboard tabs, drill-down officer analysis, and week-on-week tracking.
Result
Real-time, browser-based performance insights deployed on Cloudflare Pages — no database or server required.